


By Nicanor Perlas – August 25, 2020
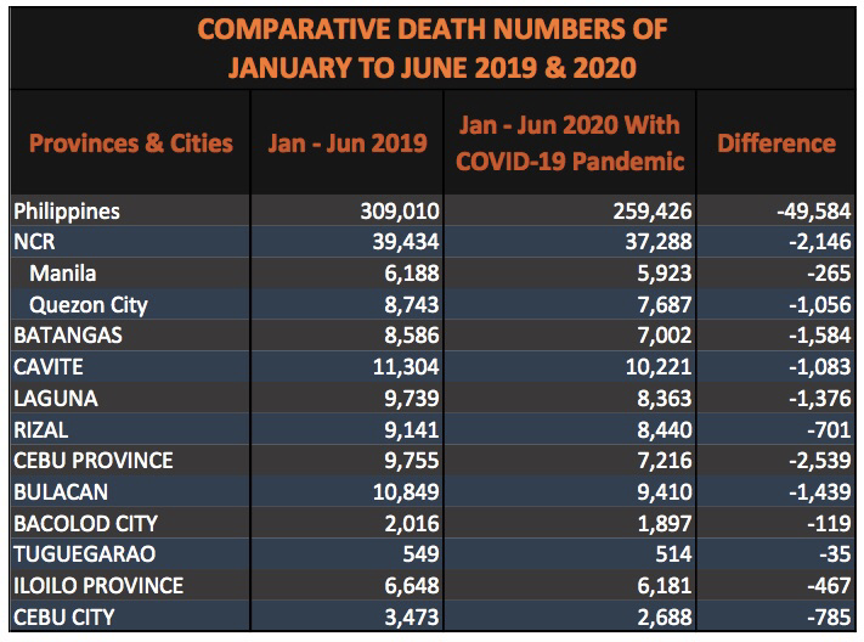
On July 29, 2020, the Philippine Statistic Authority (PSA), the official government center for statistical data in the country, released a bombshell. Yet hardly anyone noticed it. Here is what the PSA data showed. The death figures for January to June 2019 were higher by 49,584 than the deaths for January to June 2020. If we had an epidemic, then the 2020 figures should be reporting higher death figures than 2019. In short, the Philippines had no “excess deaths” in 2020 due to COVID-19 (See Table 1 below). In epidemiology, excess deaths tell us if an outbreak of a disease is serious or not.
TABLE 1: Death Numbers for Jan to June: 2019 & 2020
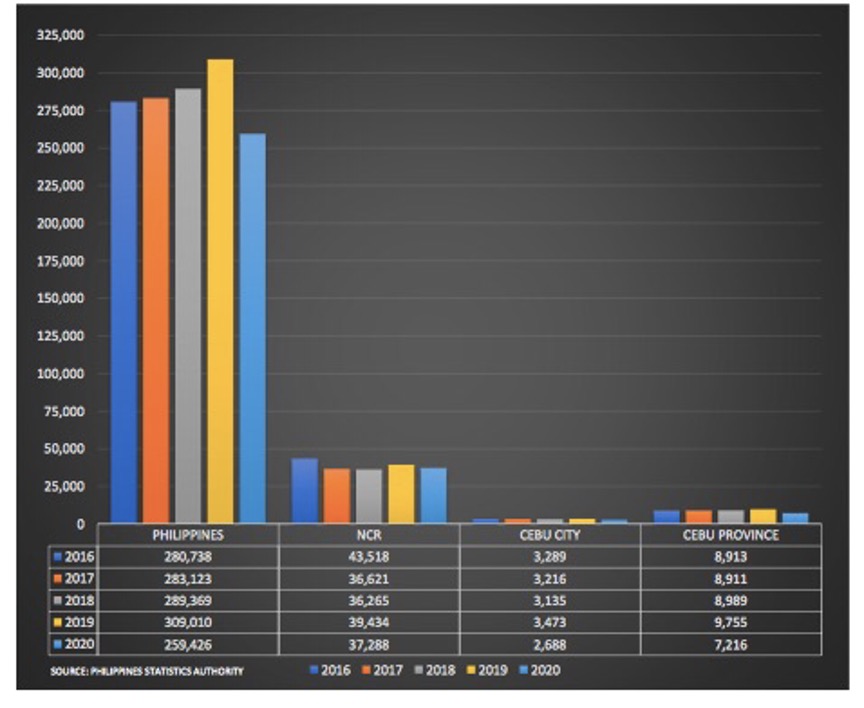
In a classic case of paradigm blindness, this incredible data did not merit analytical coverage from mainstream media. The latter believe in the epidemic, big-time. This belief makes them ignore information that would question their fear-laden reporting.One interpretation of the data could be that the lockdown was successful. It reduced the death numbers. If so, assuming that 2019 figures would continue, then the 2020 figures should have increased very slightly over the historical death figure because, after all, there were COVID-19 deaths in 2020. In the alternative, the 2020 figures should have at least maintained the historical trend of high death numbers. But this has not happened. Chart 1 below shows this very clearly. For the high lockdown (ECQ) areas of NCR, Cebu City and Cebu Province, the death numbers for January to June 2020 (light blue on the right of the cluster of bars) are consistently lower when compared to similar months in the last 4 years. There are no excess deaths. If there was an epidemic, the 2020 numbers should have been noticeably higher.
CHART 1: Historical Death Rates for ECQ Areas from January to June: 2016-2020
No Excess Deaths
Furthermore, the data is also showing the same decreased trend of total deaths in 2020 in mild lockdown (MGCQ) areas, except for a slight increase in Guimaras. Table 2 below provides a powerful rebuttal to the view that the lockdowns were successful. It compares the death figures for those areas that did not experience hard lockdowns but were in low-risk or Modified General Community Quarantine (MGCQ) areas.
TABLE 2: Deaths in MGCQ Areas, January to June:2019 AND 2020
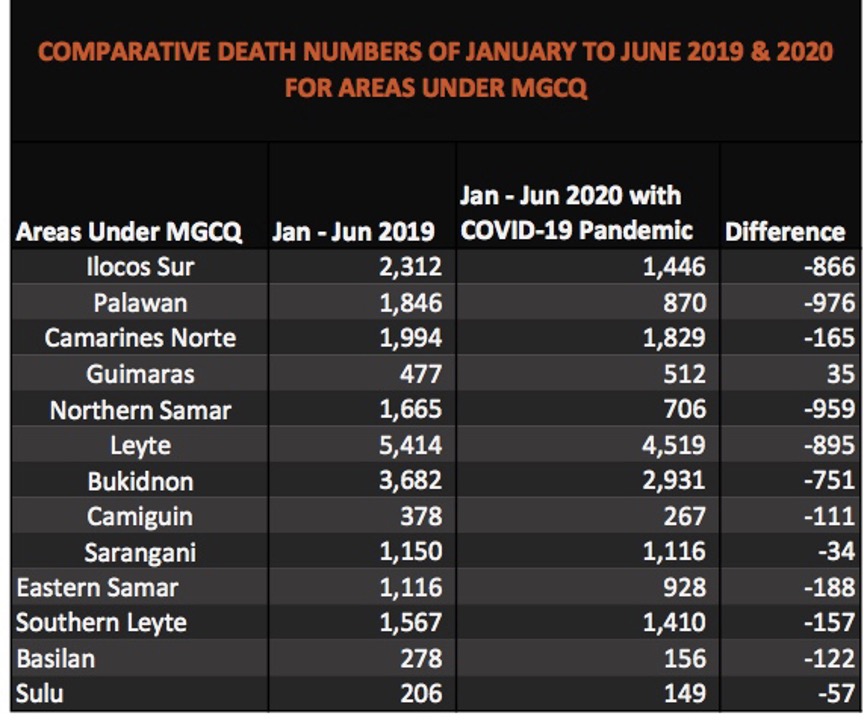
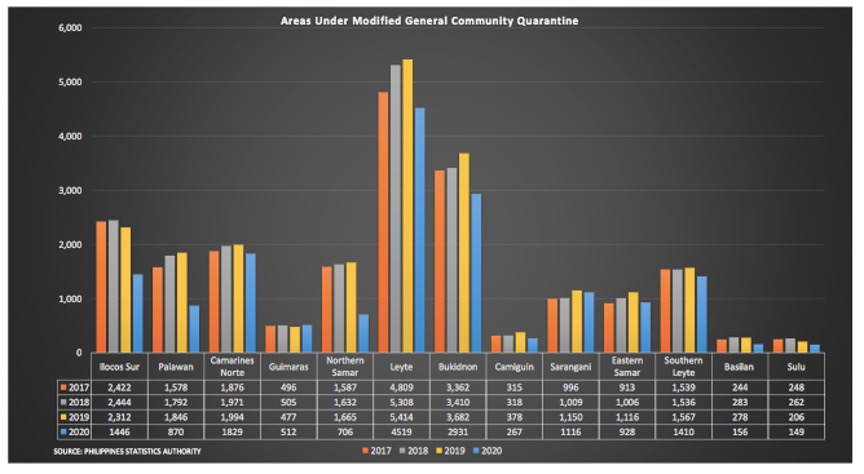
Chart 2 emphasizes this point even more. It shows the pattern for the other years: 2017 and 2018, in addition to 2019 and 2020, in Table 2. The data is saying the same thing. So whether there was a strong lockdown (ECQ areas) and or mild lockdown (MGCQ areas), the overall deaths in 2020 is lower than in previous years. The lockdown is not the causative factor in the decline of deaths. Finally, if the lockdowns were successful, what happened to the historical levels of death? Did they just vanish into thin area, especially under conditions when those with serious non-COVID-19 illness were not getting the emergency treatment they needed? It is tempting to assume that some of the historical deaths of 2019 vanished and reappeared in 2020 as COVID-19 deaths. We have repeatedly made the point that we need to distinguish between death FROM and death WITH COVID-19. The latter are deaths due to other illnesses but were labeled COVID-19 deaths.
CHART 2: Comparative Death Figures for Mild Lockdown (MGCQ) Areas
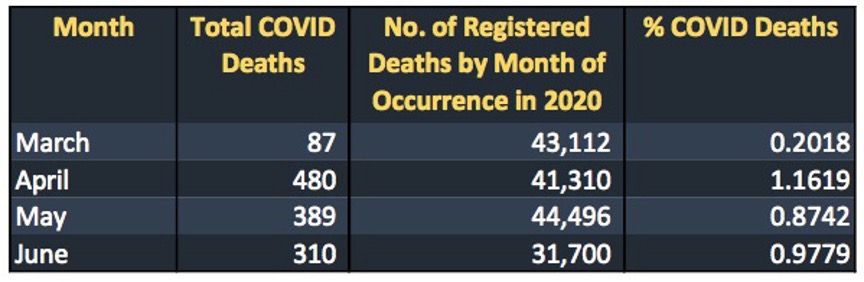
However, one can only arrive at a definitive answer to this question when the PSA releases its detailed breakdown of deaths for January to June 2020. Equally telling, assuming that the tests are accurate, if we still have an epidemic, why is the death rate getting lower and lower? See Figure 1 below for the Case Fatality Rate for the last 5 months from March 15 to August 15.Would that not be more an indication that the virus is not as deadly as once feared? In that case, the disease is present. But it is not of epidemic stature. And so, why is there fear and panic all over the place? Table 3 is another powerful evidence that the virus is not deadly. From the months around the beginning of the lockdown (March 2020), COVID-19 deaths are only around 1% of all deaths for that time period. If we were experiencing an epidemic, surely the death numbers would be much higher than this.
FIGURE 1. Case Fatality Rate from 15 March to 15 August 2020
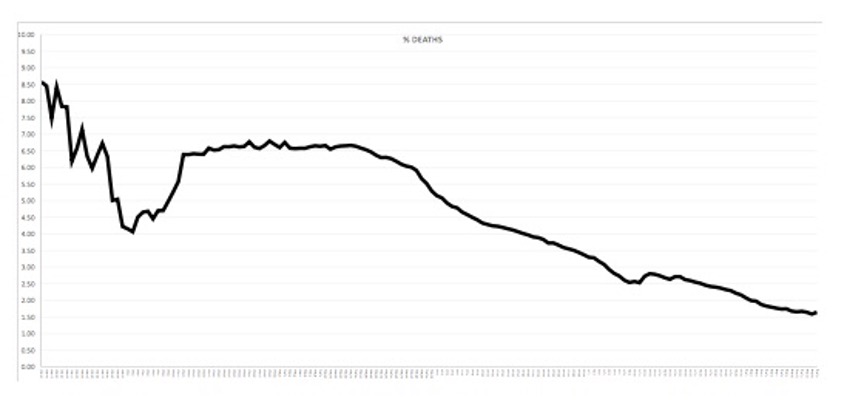
TABLE 3: COVID-19 Deaths As a Percentage of All Deaths During March to June 2020
In any event, we go back to the range of phenomena that we have been dealing with above. First, there are no excess deaths. Second, the death rate for COVID-19 has been declining for the past 5 months. Third, the percentage of COVID-19 deaths, while tragic like other deaths, is a mere 1% of all deaths recorded for 2020. With all these, we need to ask. Did we really have an epidemic? Why are more and more repressive measures being put in place? Why all the talk about vaccines as a solution as if people are dying all over the place? If there is no current epidemic, why is government continuing with the strong lockdowns instead of lighter and more precise approaches? Where are we going with all of these? Remove the blinders, awaken to the truth, free one’s self from fear and illusions, question illegal authority. Only then can we be truly human and be courageous to fully deserve our rights and freedom.

